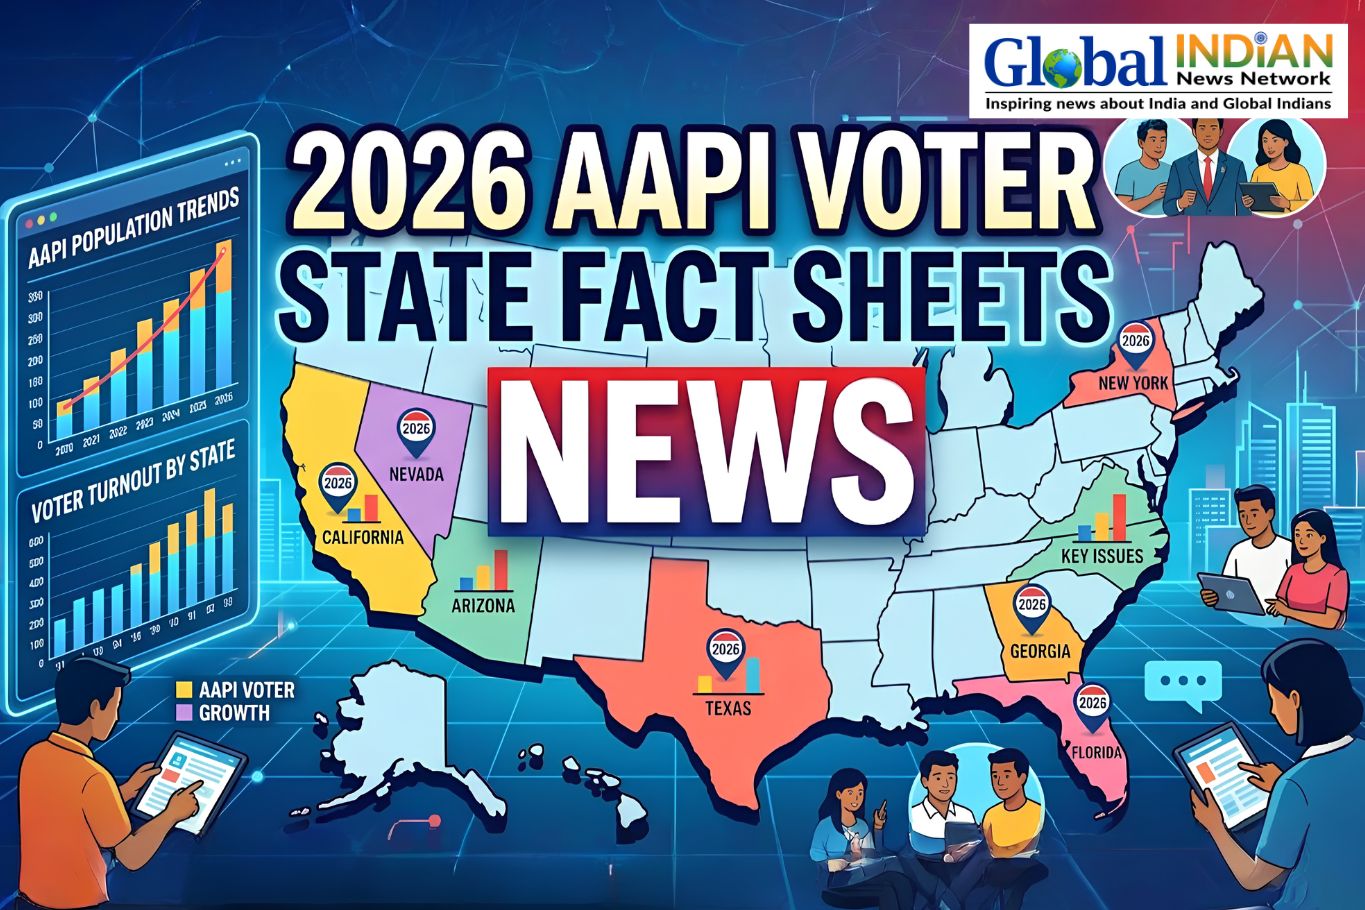
 Asian Americans, Native Hawaiians, and Pacific Islanders collectively represent one of the U.S.’ fastest growing racial demographic cohorts. This rapidly expanding population has concurrently become the nation’s fastest-growing voter bloc.
In recognition of the AAPI community’s rapid growth and impact, AAPI Data has partnered with Asian & Pacific Islander American Vote (APIAVote) to create state-specific data factsheets on the AAPI electorate, serving as vital resources tailored to all 50 states and the District of Columbia.
Key data points include:
- Number of AAPI eligible voters statewide
- Aggregate AAPI population statistics and growth trajectories
- Prominent ethnic subgroup populations (e.g. Chinese, Indian, Filipino)
- Counties with highest AAPI residential density
- Limited english proficiency rates
- AAPI voter engagement identification
- Socioeconomic challenge indicators
For political campaigns, elected representatives, advocacy organizations, media entities and academic researchers, these fact sheets can unlock valuable insights, serving as a resource to better understand and strategically engage the AAPI electorate in each state.
Asian-Indians as poer each states
Alabama – 18,026
Arizona – 75,273
Arkansas – 15,000
California – 967,504
Colorado – 43,100
Connecticut – 67,991
Delaware – 18,531
District of Columbia – 10,473
Florida – 231,340
Georgia – 191,013
Idaho – 4,416
Illinois – 280,737
Indiana – 60,358
Iowa – 18,282
Kansas – 21,969
Kentucky – 19,937
Louisiana – 15,191
Maine – 2,373
Maryland – 116,946
Massachusetts – 144,091
Michigan – 138,644
Minnesota – 52,192
Mississippi – 7,887
Missouri – 41,272
Montana – 840
Nebraska – 10,753
Nevada – 22,037
New Hampshire – 11,859
New Jersey – 448,645
New Mexico – 7,018
New York – 417,890
North Carolina – 142,203
North Dakota – 2,268
Ohio – 111,815
Oklahoma – 18,935
Oregon – 36,193
Pennsylvania – 173,014
Rhode Island – 10,107
South Carolina – 33,760
South Dakota – 2,149
Tennessee – 43,949
Texas – 588,500
Utah – 14,854
Vermont – 2,806
Virginia – 174,842
Washington – 172,827
West Virginia – 4,440
Wisconsin – 39,669
Wyoming – 1,024
District-of-Columbia-Fact-Sheet-2026
North-Carolina-Fact-Sheet-2026